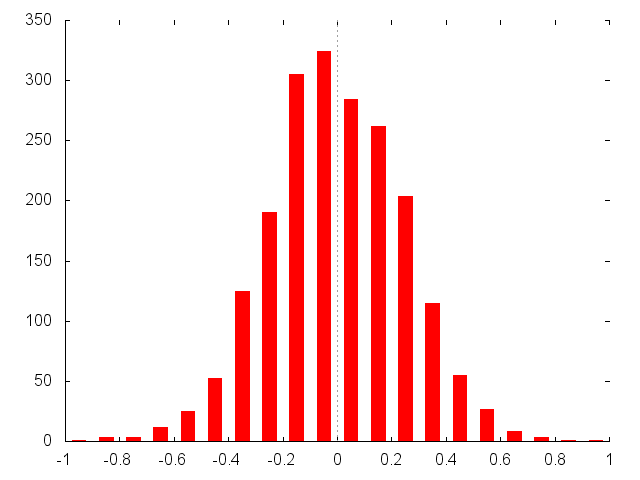
Let's say you've written a random number generator that produces numbers
with a Gaussian (i.e. normal) distribution, and you want to visually check the
distribution using a frequency histogram. This can be done with gnuplot using
its support for user functions and the smooth frequency
command. The technique used here comes from Professor David MacKay of
Cambridge University (http://www.inference.phy.cam.ac.uk/teaching/comput/C++/).
The output of the random number generator is recorded in a text file as a single column of floating point numbers:
-0.355534673
0.13217762
-0.842048585
-0.131302223
0.03265043
0.190827265
-0.25680709
-0.072149448
-0.156086803
0.065009468
-0.003330263
-0.059023393
-0.017556788
-0.06090761
-0.205948548
-0.18360047
...
The gnuplot commands to plot this are shown below. The principle of
operation is to plot not each value from the file, but to count the number of
values that fall into specific ranges. The first thing we need to do is group
the numbers into collections of similar value; this is done by the functions
rounded() and bin_number().
rounded(x) takes the x parameter and rounds it to its nearest
multiple of bin_width. This way, the fixed values returned can
be counted into bins. However, the actual value returned by
rounded() is first shifted up or down by an amount equal to the
bin_width multiplied by the offset. Typically, the offset will
be 0.5 since this would position the bar at the centre of its range on the X
axis.
The bin_number() function uses bin_width to
compute how many multiples the X parameter is of the range (and, therefore,
the particular bin into which the X parameter should be counted.
bin_number() does this by converting values into grouped values
(the bins). For instance, with bin_width=0.1, values between 0.0 and 0.09
will be rounded down to 0, 0.10 ... 0.19 will be rounded down to 0.1, 0.20 to
0.29 will be 0.20, and so on.
Once we have arranged the disparate values of the data file into a
selection of predefined values, we can then count the instances of those
values, which we then plot. Since we don't want to plot the actual X values,
but the number of them in certain bins, instead of the typical
using command, we use gnuplot's smooth command,
with the frequency option:
Note that the plot command includes brackets around the using
values. The brackets tell gnuplot to interpret these values as numerical
expressions, rather than column numbers (although a dollar followed by a
number explictly references a column when inside brackets). Thus,
(rounded($1)) means "pass the value in column one to the
rounded() function, and use the value returned as the X-axis
coordinate. And (1) means to increment the bin value (i.e. Y) by one for each
corresponding X value.
clear
reset
set key off
set border 3

# Add a vertical dotted line at x=0 to show centre (mean) of distribution.
set yzeroaxis

# Each bar is half the (visual) width of its x-range.
set boxwidth 0.05 absolute
set style fill solid 1.0 noborder

bin_width = 0.1;

bin_number(x) = floor(x/bin_width)

rounded(x) = bin_width * ( bin_number(x) + 0.5 )

plot 'gaussian.txt' using (rounded($1)):(1) smooth frequency with boxes
This gives us the following result:
| Home | About Me | Copyright © Neil Carter |
Content last updated: 2012-02-28